What are filters good for?
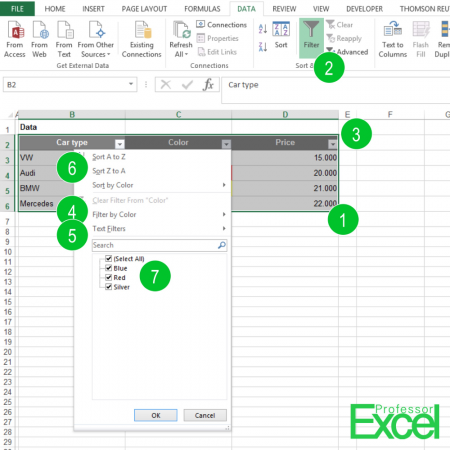
- The obvious application is to filter the data you want to see. All other rows will be hidden. You can select the data you want to see by color (number 4 in above picture) or cell content (number 5).
- Furthermore, you can sort your data (number 6).
- Also, a filter often provides a quick overview of the range of your data when you just click on the small arrow and check the content of the specific column (7). In this way, outliers can be identified easily.
How to set up filters in Excel?
Setting up filters in Excel is easy (the numbers are corresponding to the picture above):
- Select all your data you want to be filtered.
- Click on “Filter” on the Data ribbon or alternatively press Ctrl + Shift + l
Now, small arrow boxes are added on the header row (3).
Please note that only the first 1,000 values are shown (in alphabetical order). Please be careful sorting your data as formulas or cell references might be damaged.