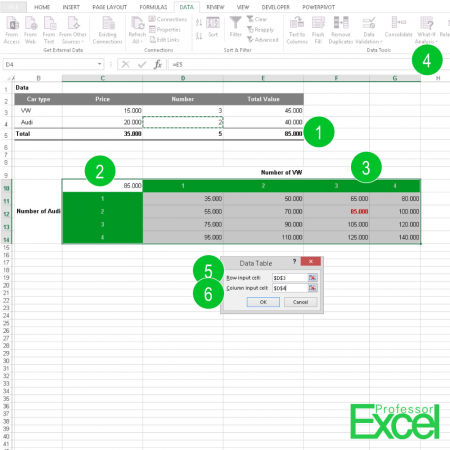
 An advanced method of analyzing the results of your calculations is to use a Data Table. Excel simulates the complete calculation by changing two input values. In this article we’ll explore how to create data table.
How to create a data table
Let’s say, we got 3 VW cars and 2 Audi cars as shown in the picture above. The total value is calculated in cell E5. Now we want to know how the value changes if we vary the number of VW and Audi (the numbers are corresponding to the picture on the right hand side).
- Do all the calculations for one combination (for us 3 VW and 2 Audi). The result must be a single value.
- Prepare the data table: Link the result to the top left corner of your data table. In our case cell C10 contains a reference to cell E5 (“=E5”).
- As a second part of the preparation of the data table, prepare the columns and rows. Therefore, the top row and the leftmost column should have the values you want to change. In our case, that’s the number of VW and number of Audi (the cells with the green background).
- Once the preparations are done, we can create the complete data table. Click on “What-If Analysis” on the Data ribbon. Click on “Data Table”.
- You have to determine two values: As the Row input cell, select the cell in your calculation which you want to be changed in the columns. In our case that’s the cell D3 for the number of VW.
- Select the Column input cell the same way
Now, Excel calculates all combinations given in your table. In our example cell F12 has the above calculated value (85,000).
Please note that in older versions of Excel, the calculation result as well as the input values had to be on the same worksheet as the data table.

